

Election Postscript
Trump wave touches the Chippewa Valley
In the feature story titled “Red, Blue, or Purple?” in the Nov. 2 issue of Volume One, we examined the voting tendencies and characteristics of Eau Claire and the Chippewa Valley. Having just gone through a general election, what new traits and trends, if any, do we now see?
• We went to the polls, especially in Eau Claire, with nearly 70 percent of eligible voters casting a ballot.
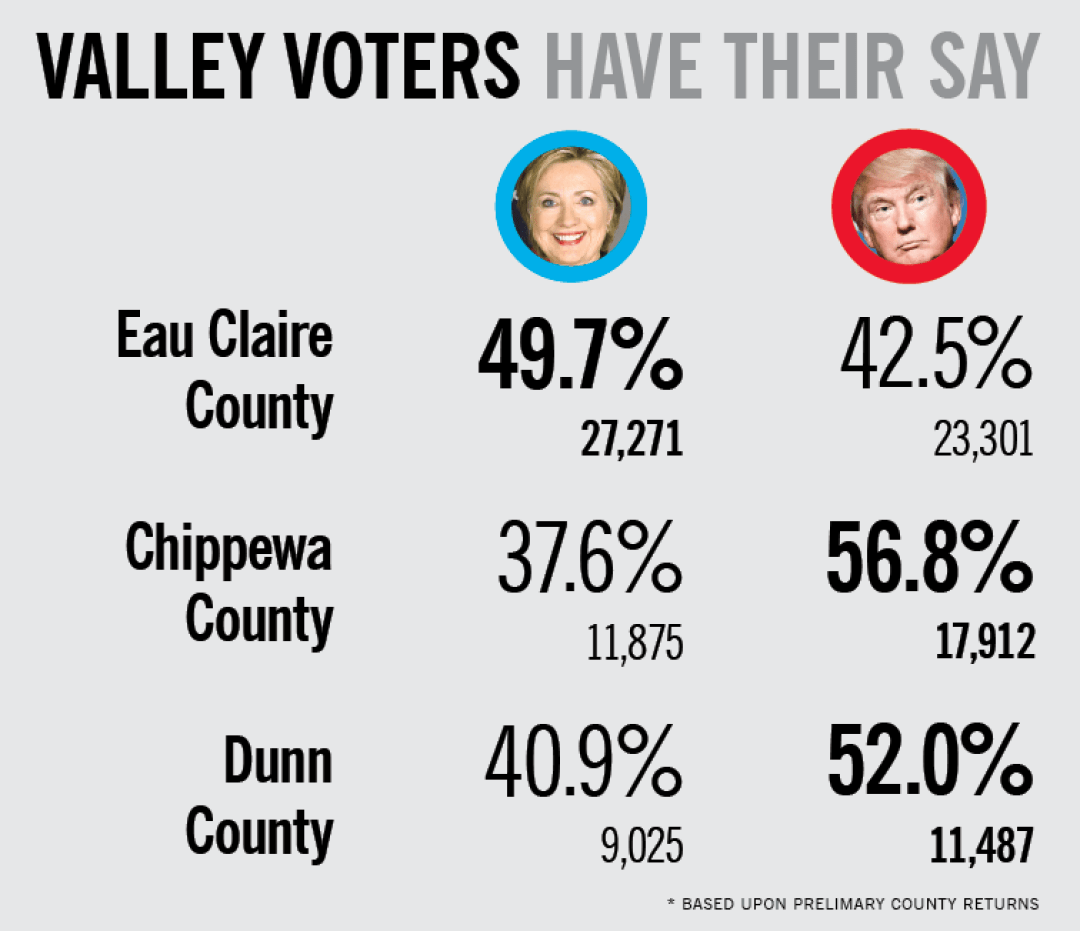
• We didn’t vote for the Democratic candidate, Hillary Clinton, as much as we had for prior Democratic presidential nominees. Every Chippewa Valley county featured a decrease in total Democratic presidential votes compared to 2012, and all but Eau Claire county had an increase in total vote for the Republican nominee (Donald Trump this time, Mitt Romney last time) over four years ago.
• The Democratic decline exceeded the GOP increase in those counties, suggesting that a good number of people who previously voted Democratic for president either chose a third party, skipped making a choice, or stayed home. However, counties where the Dem decline/GOP increase were most closely matched – and where more voters likely switched to voting Republican – included the recently-blue rural Pepin, Buffalo, Jackson, and Trempealeau counties. This may indicate these counties are catching up with the national rural trend towards the GOP – future elections will tell us if this is so.
• The state Assembly control map in western Wisconsin evolved due to those voting changes in that same territory south of Eau Claire: Consider Republican Treig Pronschinske’s upset victory over four-term incumbent Democrat Chris Danou in the 92nd District.
• In the city of Eau Claire, 29 of 48 wards with significant votes in 2012 and 2016 showed a decline in the two-party Democratic vote percentage (not including third party vote). This was most visible towards the north side – and especially in Wards 13 and 16 near the airport, with a nearly 10 percent drop in Democratic vote percentage compared to GOP vote percentage.
• In the same two-way comparison, increases in the Democratic share of the vote were mostly seen in the Third Ward and across wards south of Clairemont Avenue.
• Finally, just counting the Republican and Democratic vote, Eau Claire was nearly 10 percentage points more Democratic than the state, compared to 8 percentage points in recent elections.
